discovery
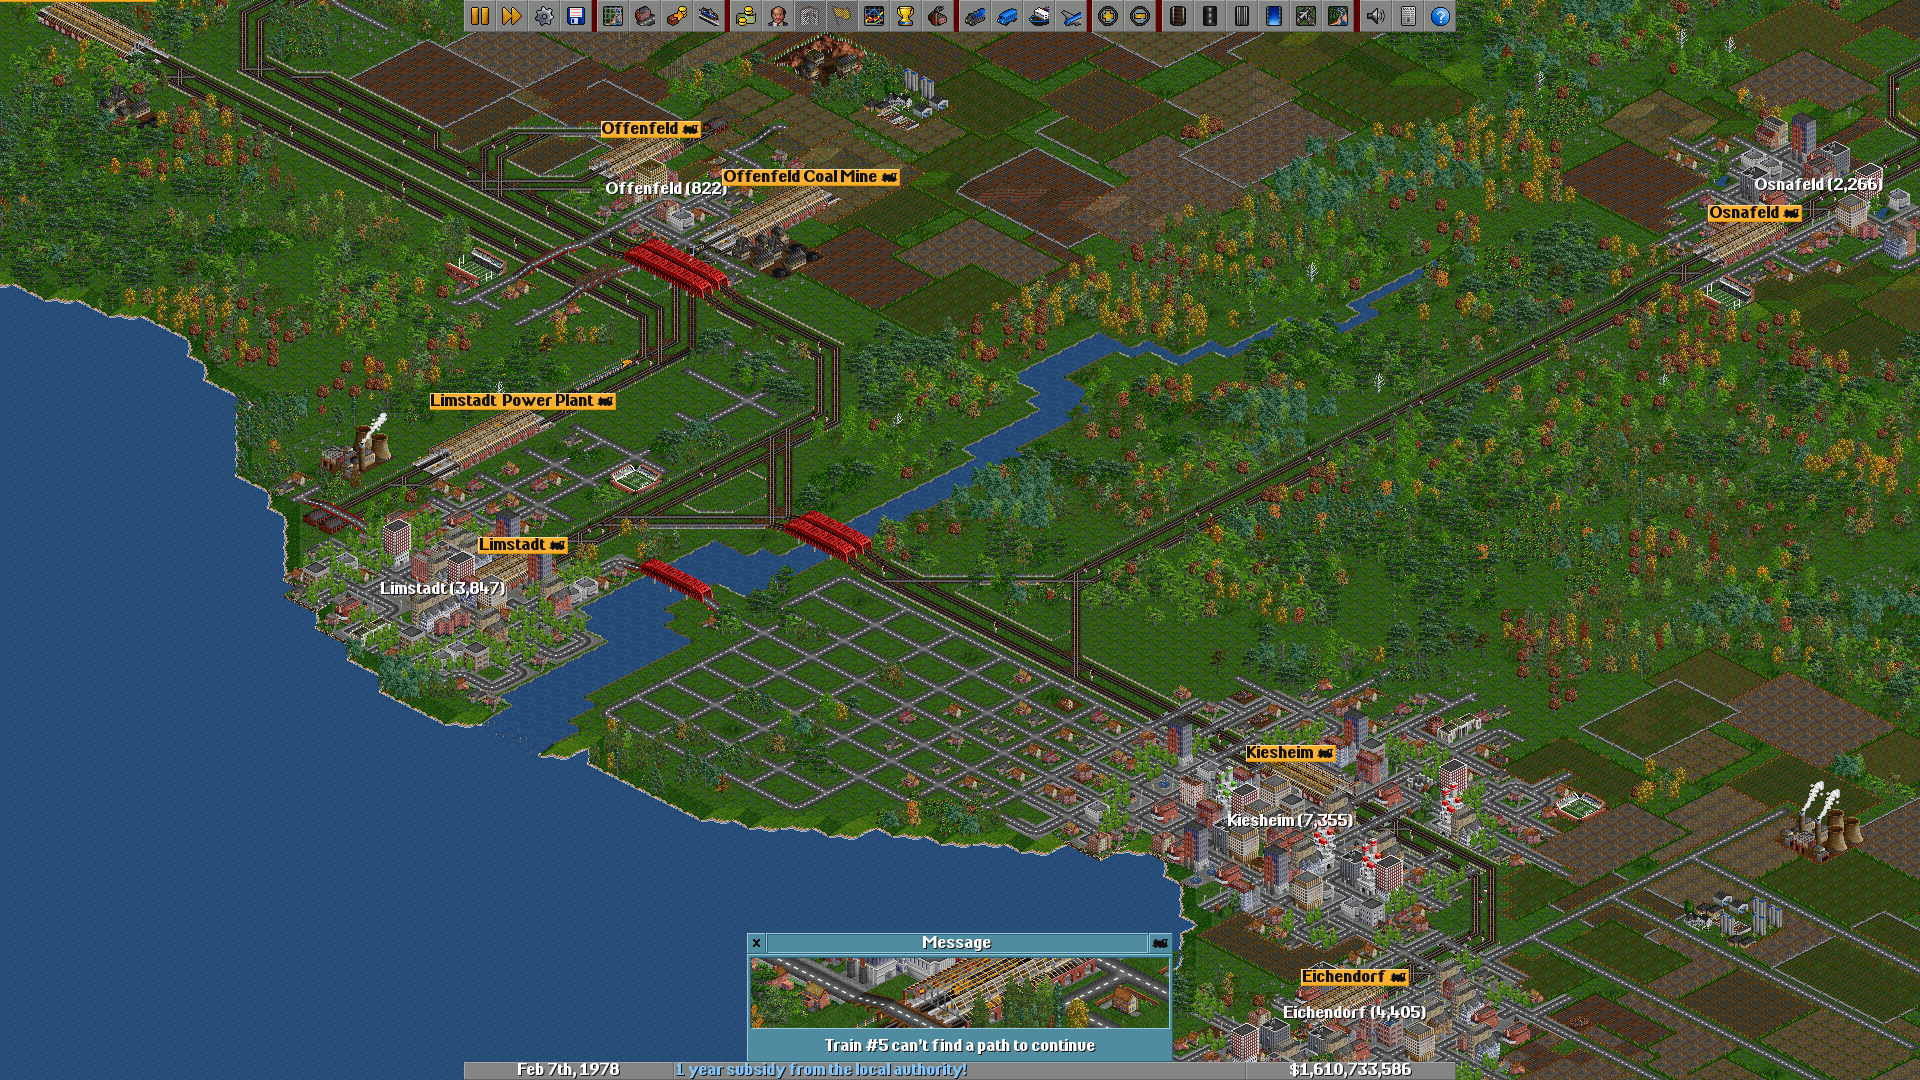
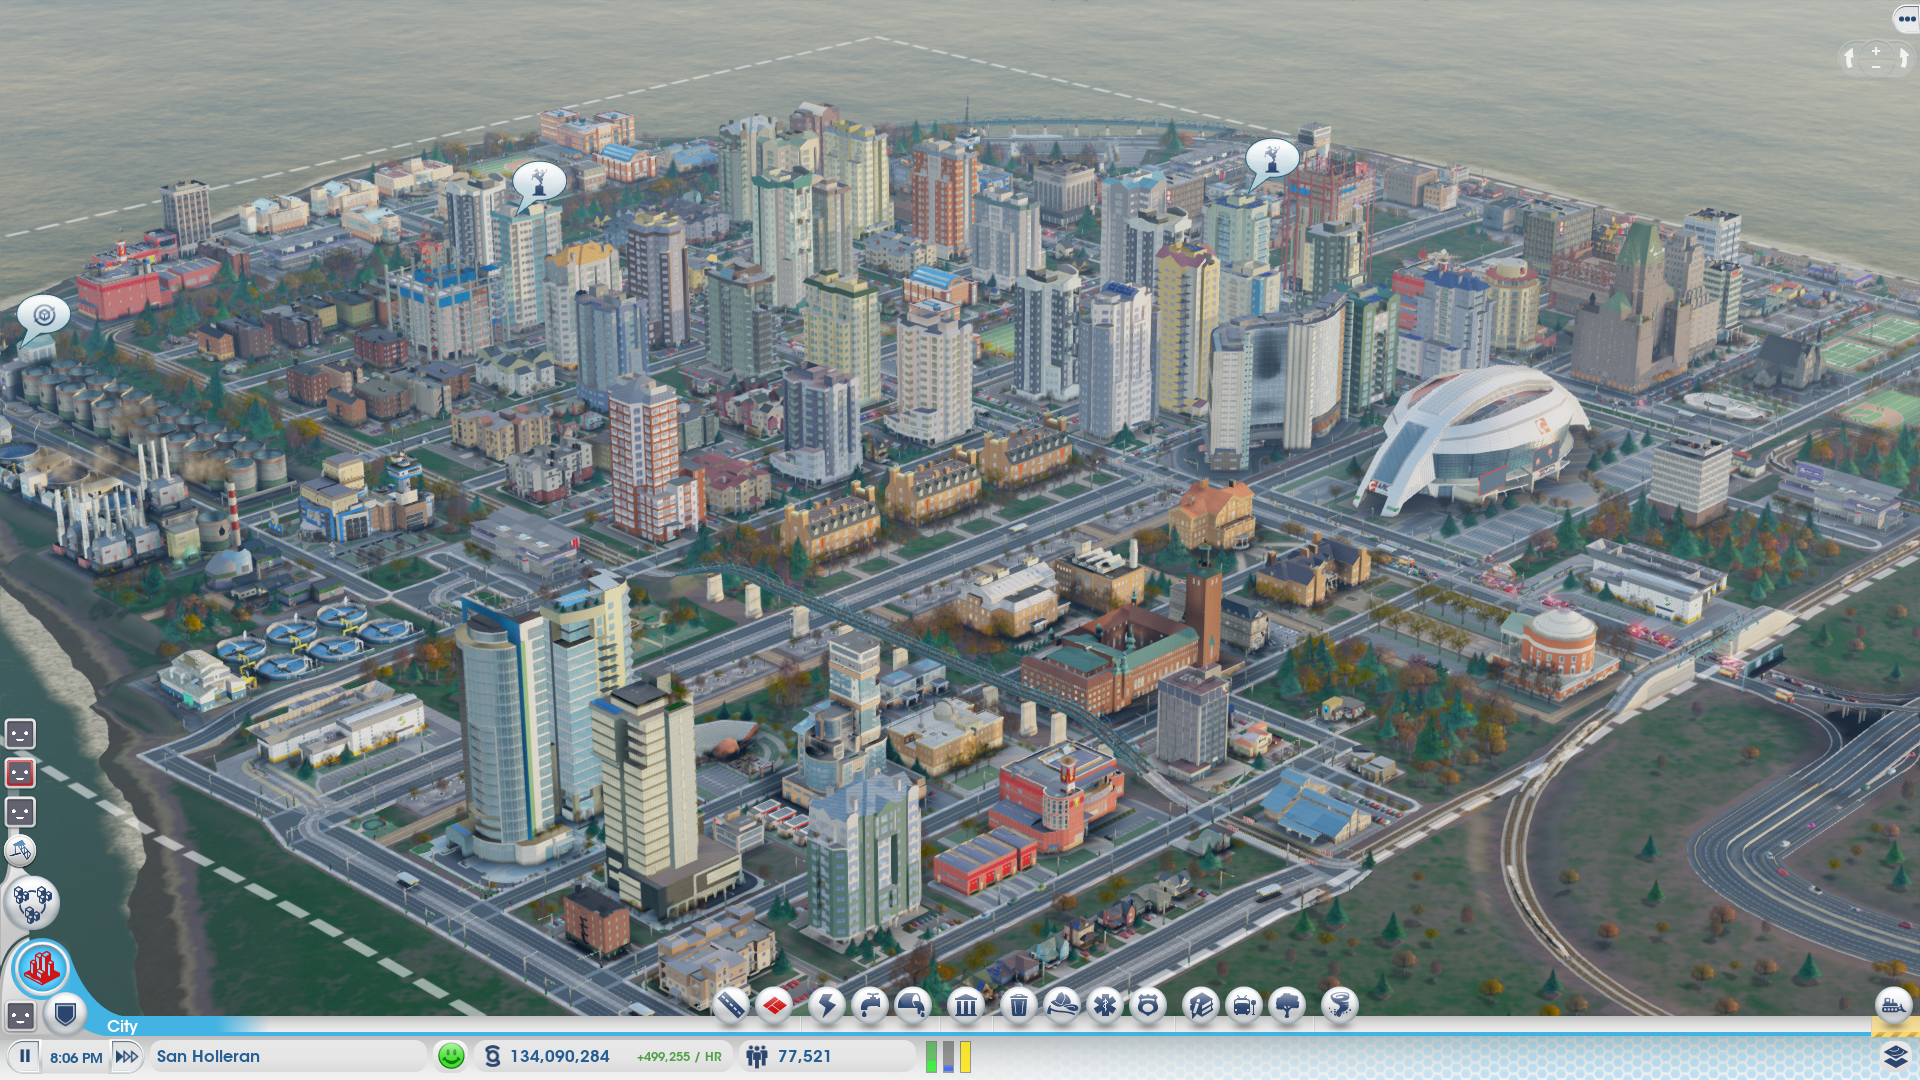
My introduction to Geographic Information System (GIS) integrated programs transpired through my growing interest in fantasy cartography, particularly grounded in real-world urbanism principles. This interest began in my childhood from playing world-building simulator games like Chris Sawyer's work (Rollercoaster Tycoon, Transport Tycoon), or other similar franchises, SimCity or City Skylines. Using these simulations as the test-bed for concepts I was learning in Engineering throughout high school always added a layer of true objective that reminded me that it was never just play.
self-directed projects
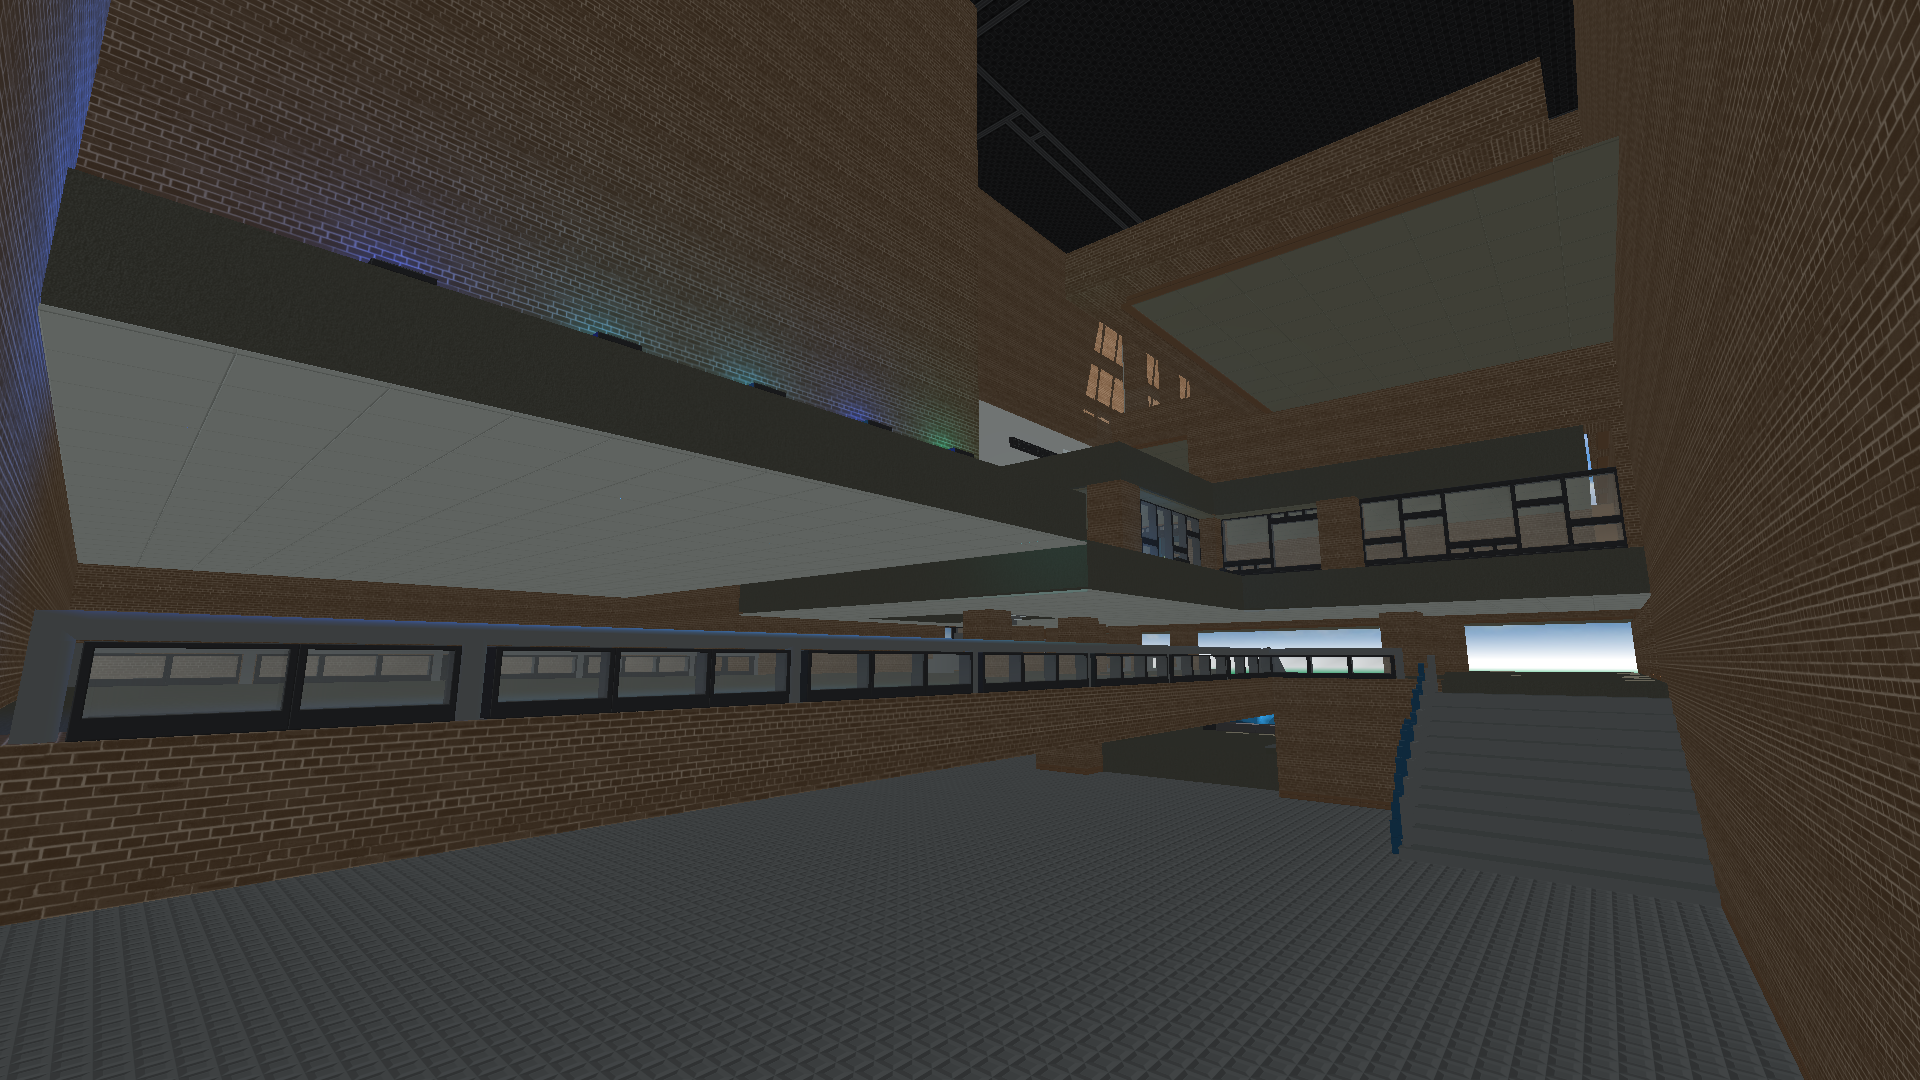
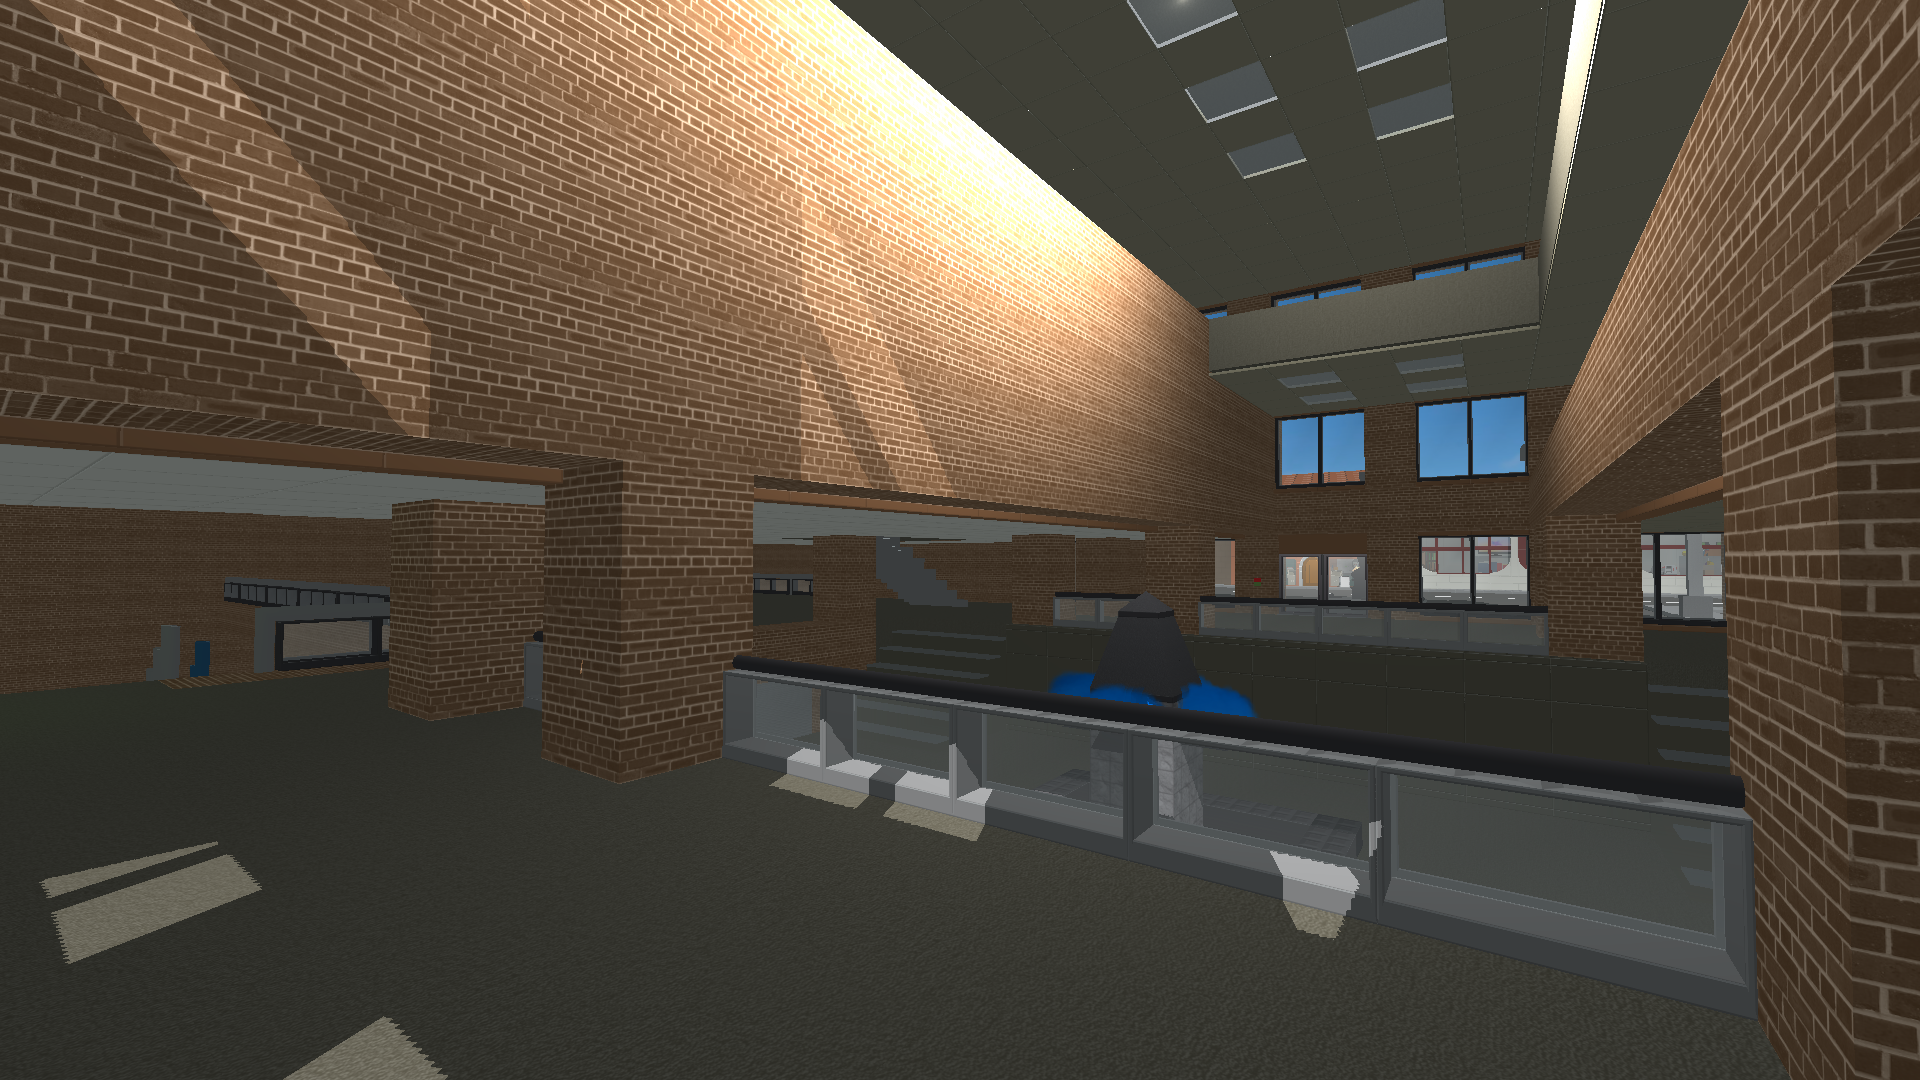
Growing up just outside of Boston, with my father commuting into Cambridge every single morning, my affection towards the MBTA system was inevitable. As I got older and my frontal lobe started to mature, I began to understand the reality behind some of Boston’s systemic issues, many of which directly impact the MBTA or explain some of its most talked-about faults. As a design student, I found myself reading a lot of fantasy cartographers’ MBTA redesigns and realized how much more convincing and satisfying those maps were when they respected real-world conditions, things like grade separation, existing rights-of-way, and the historical sociocultural makeup of the neighborhoods that we’re designing for. Although this wasn’t the main focus of my degree, it became my favorite side project. Since 2024, I’ve been publishing some of my experiments and iterations online through a Mapbox API-powered site called Metro Dreamin’. When that platform hit its limits, I started exploring block-based programming as part of a larger process of learning Python. A lot of the visual side of this work also happened in Adobe Suite, where I worked on creating more realistic turn radii and graphics that followed MBTA design guidelines more closely.
Early Coordinate Based Iteration
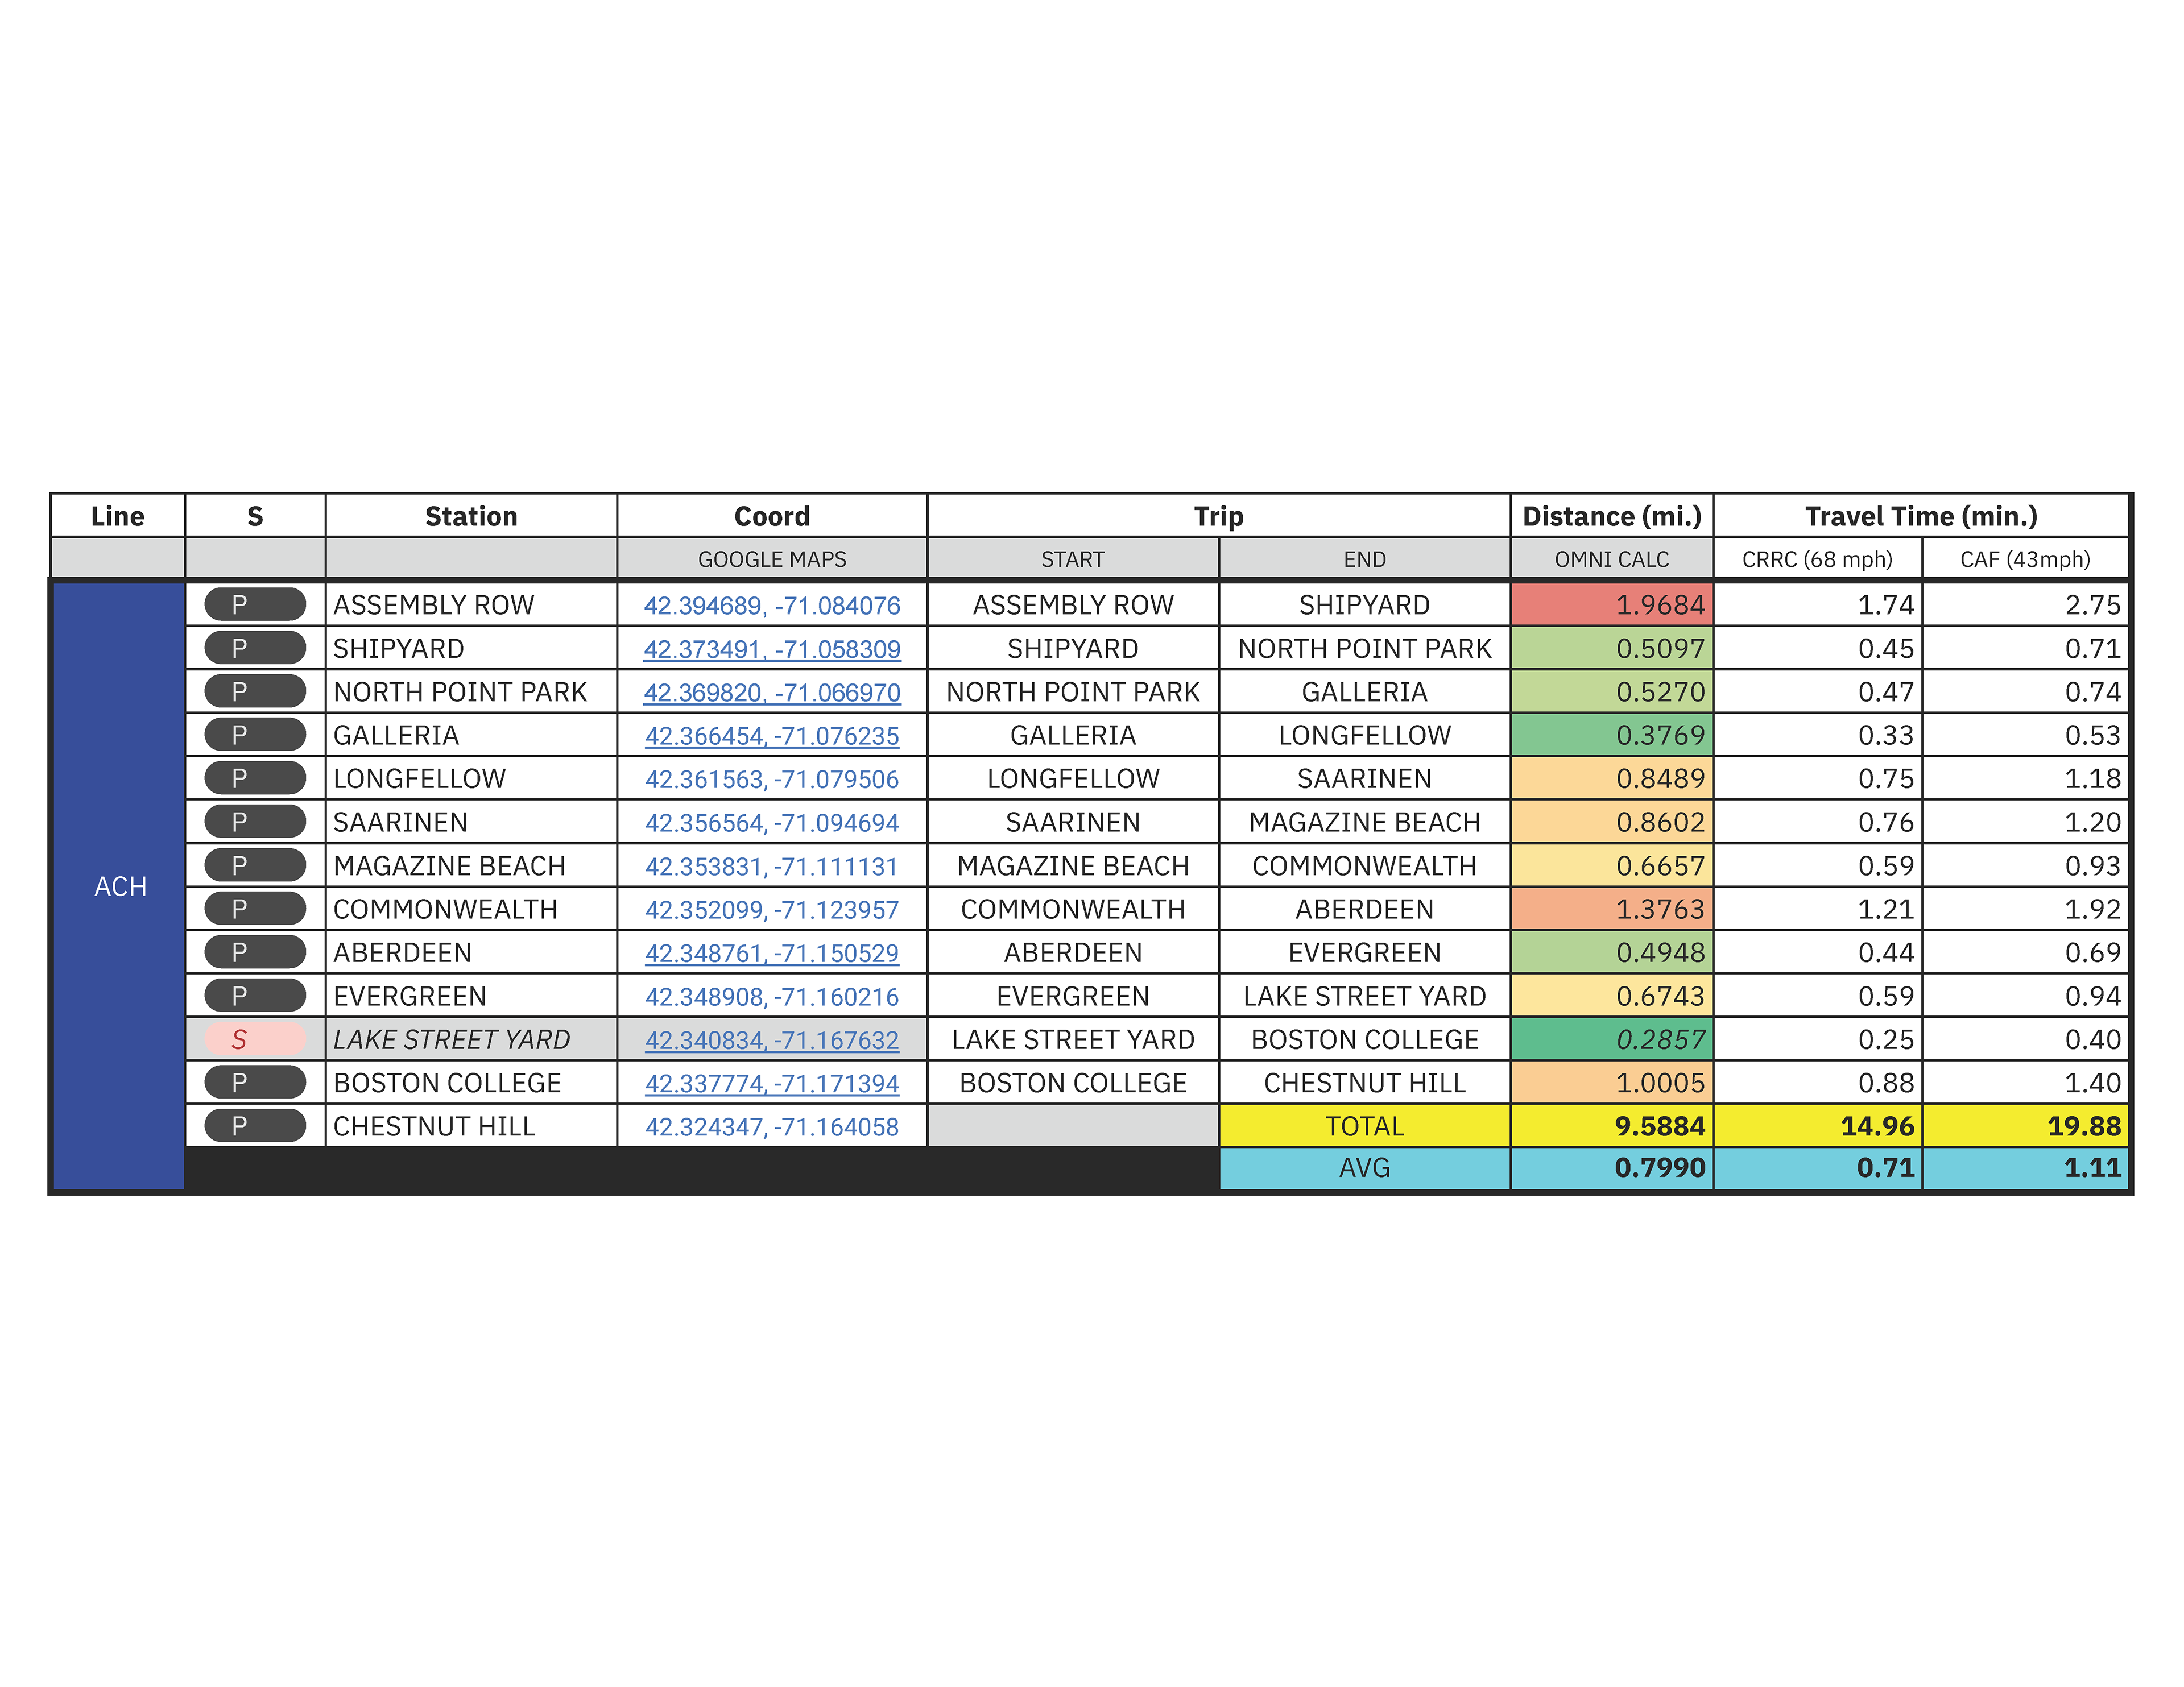
Iteration IV Datatable
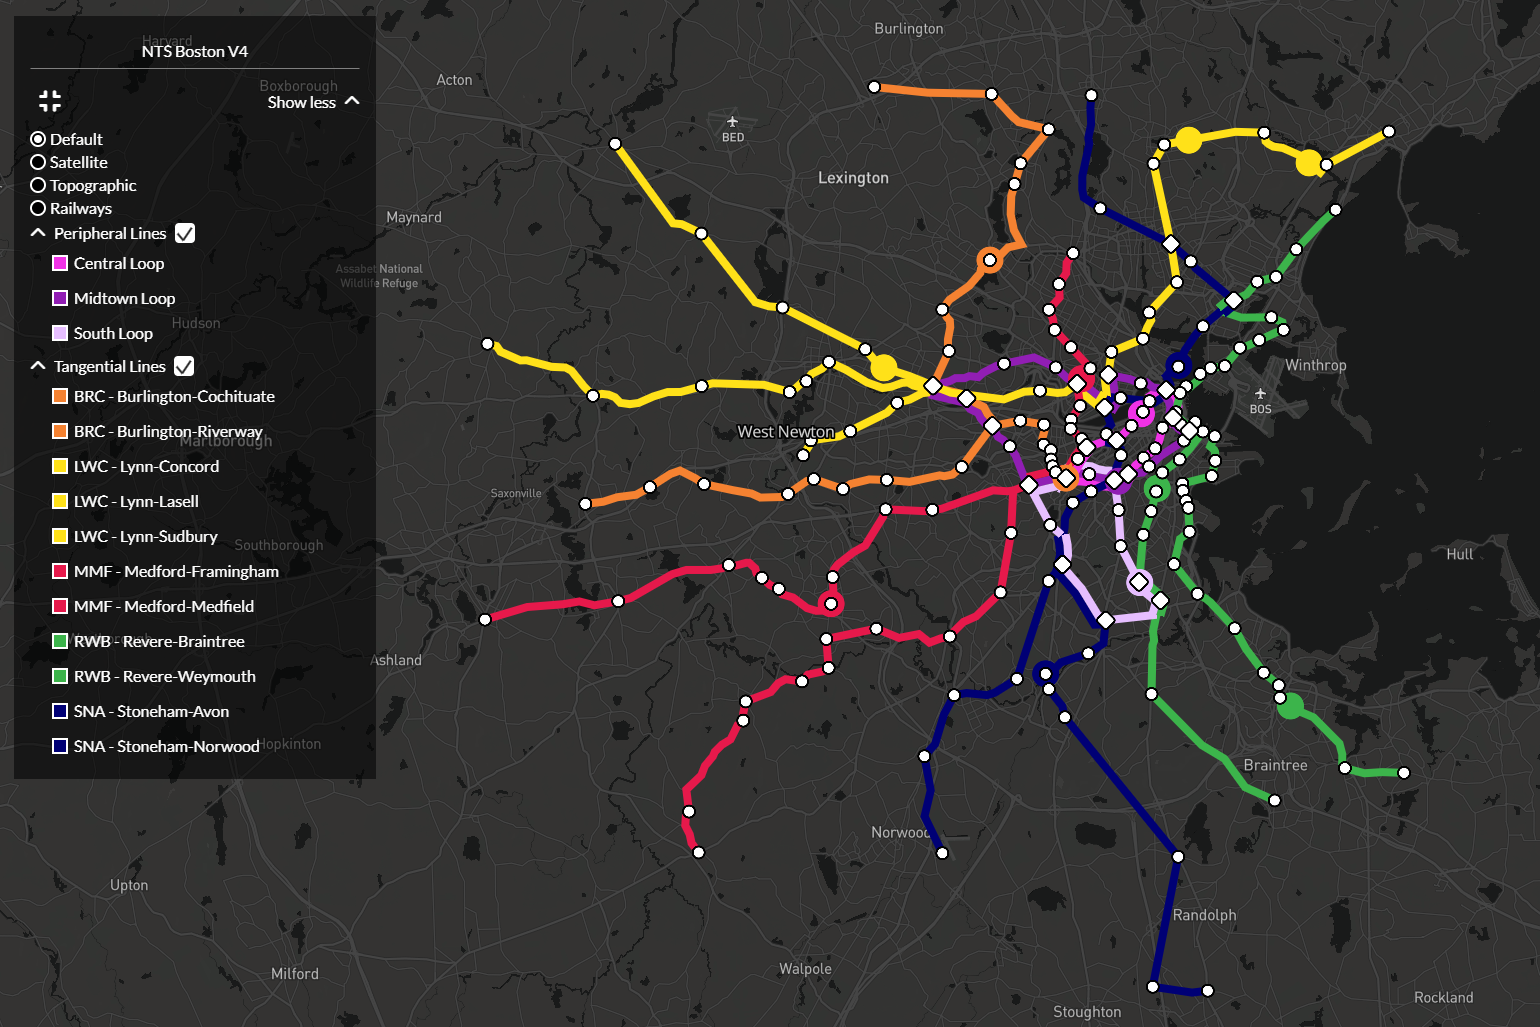
Iteration IV
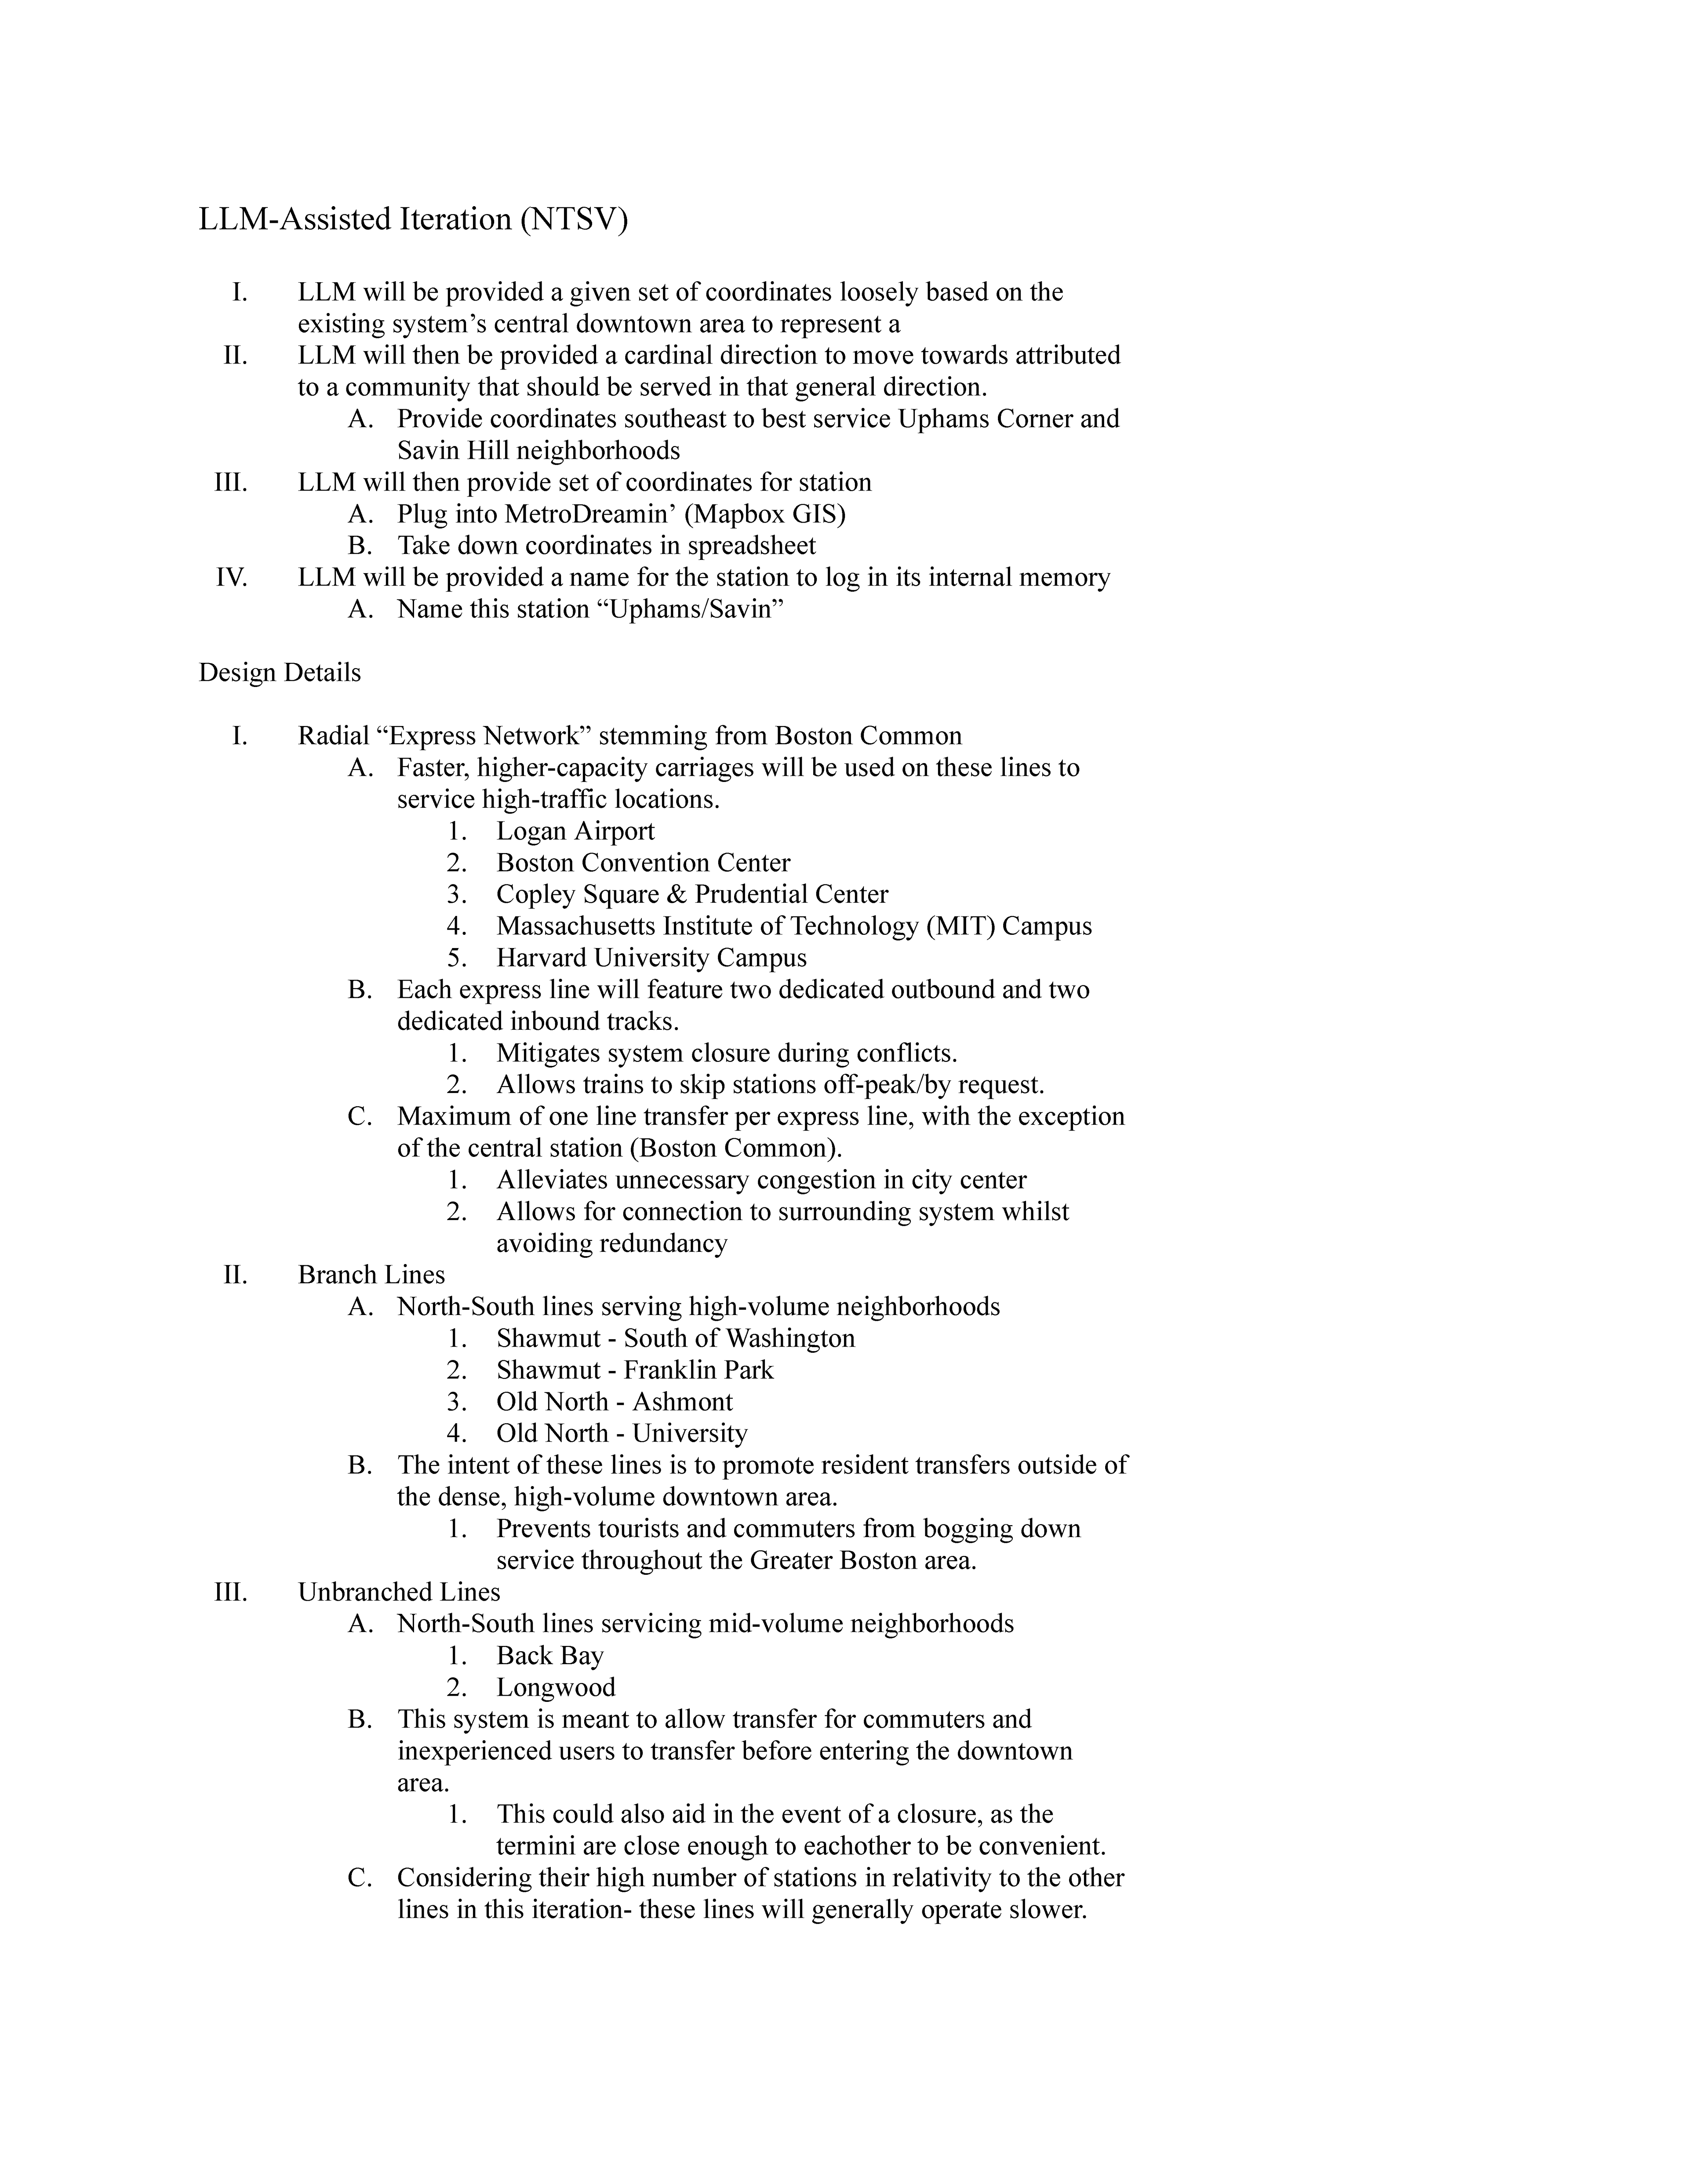
Iteration V (Outline)
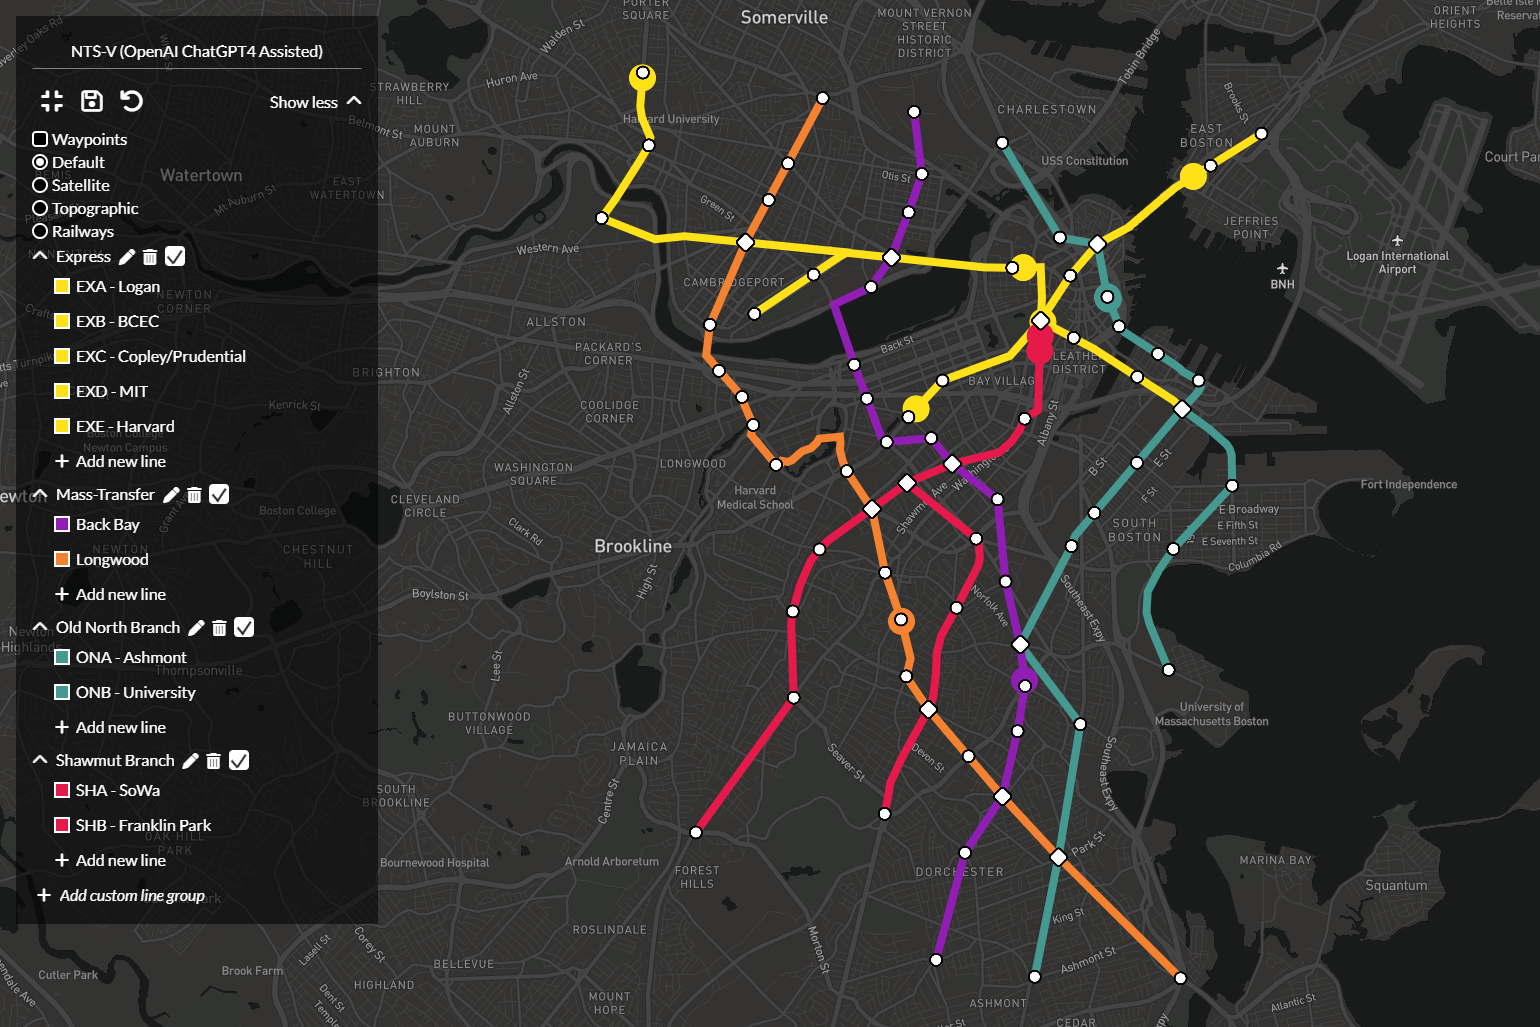
Iteration V (LLM-Assisted)
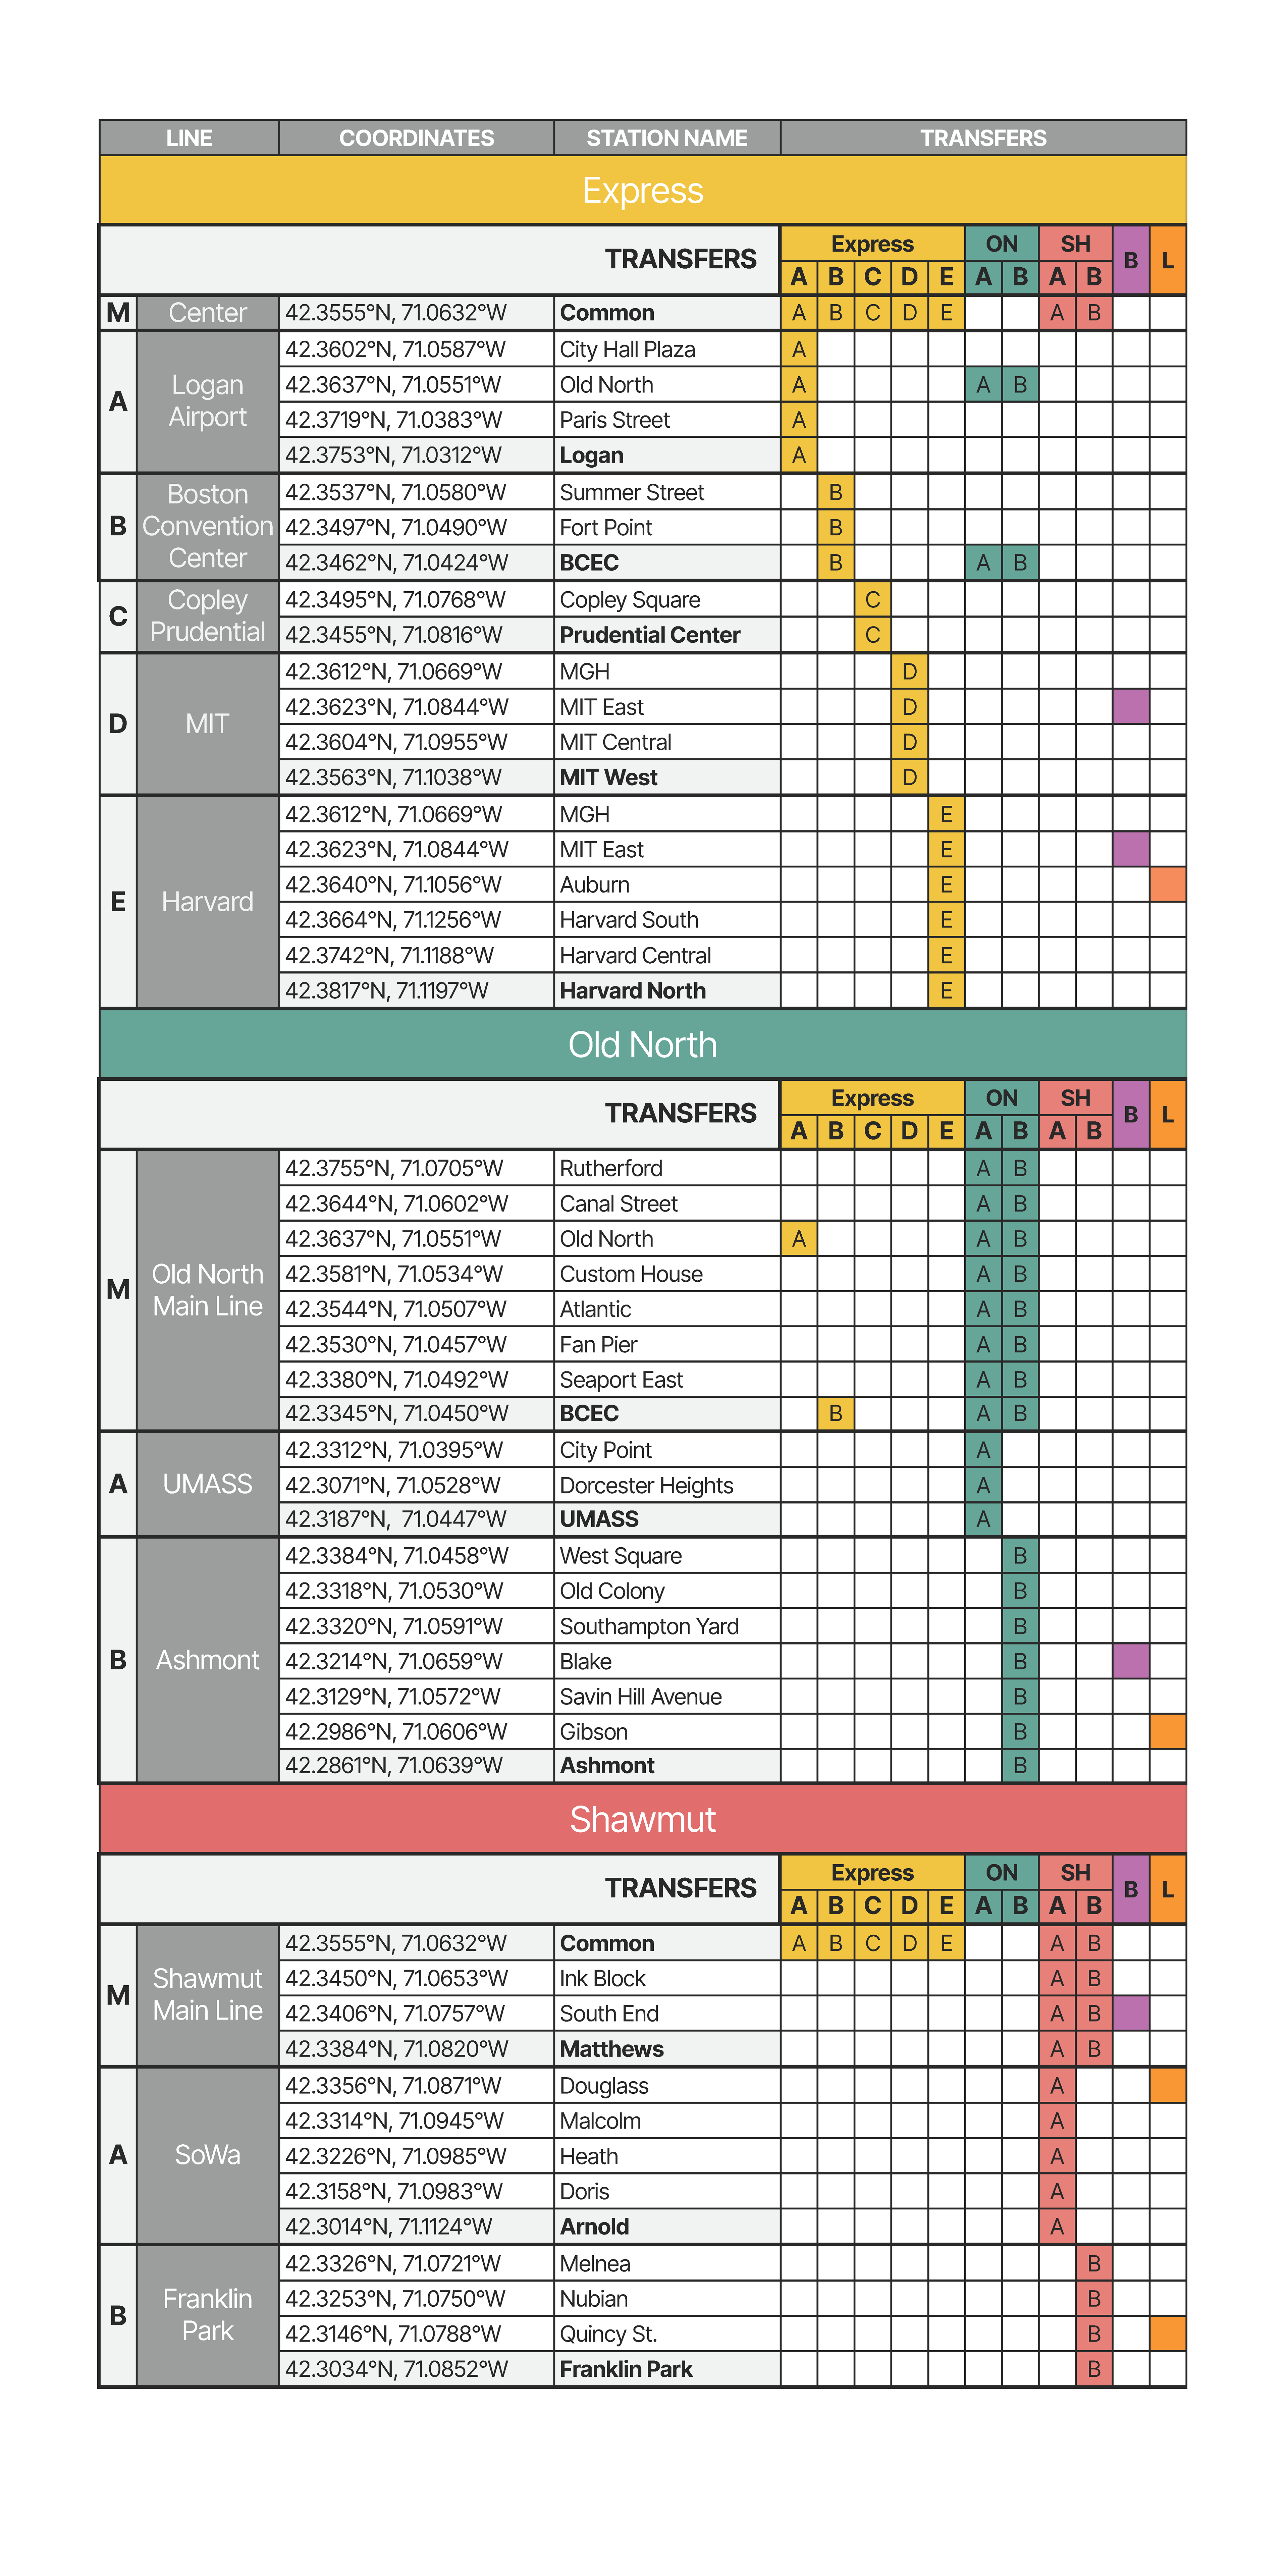
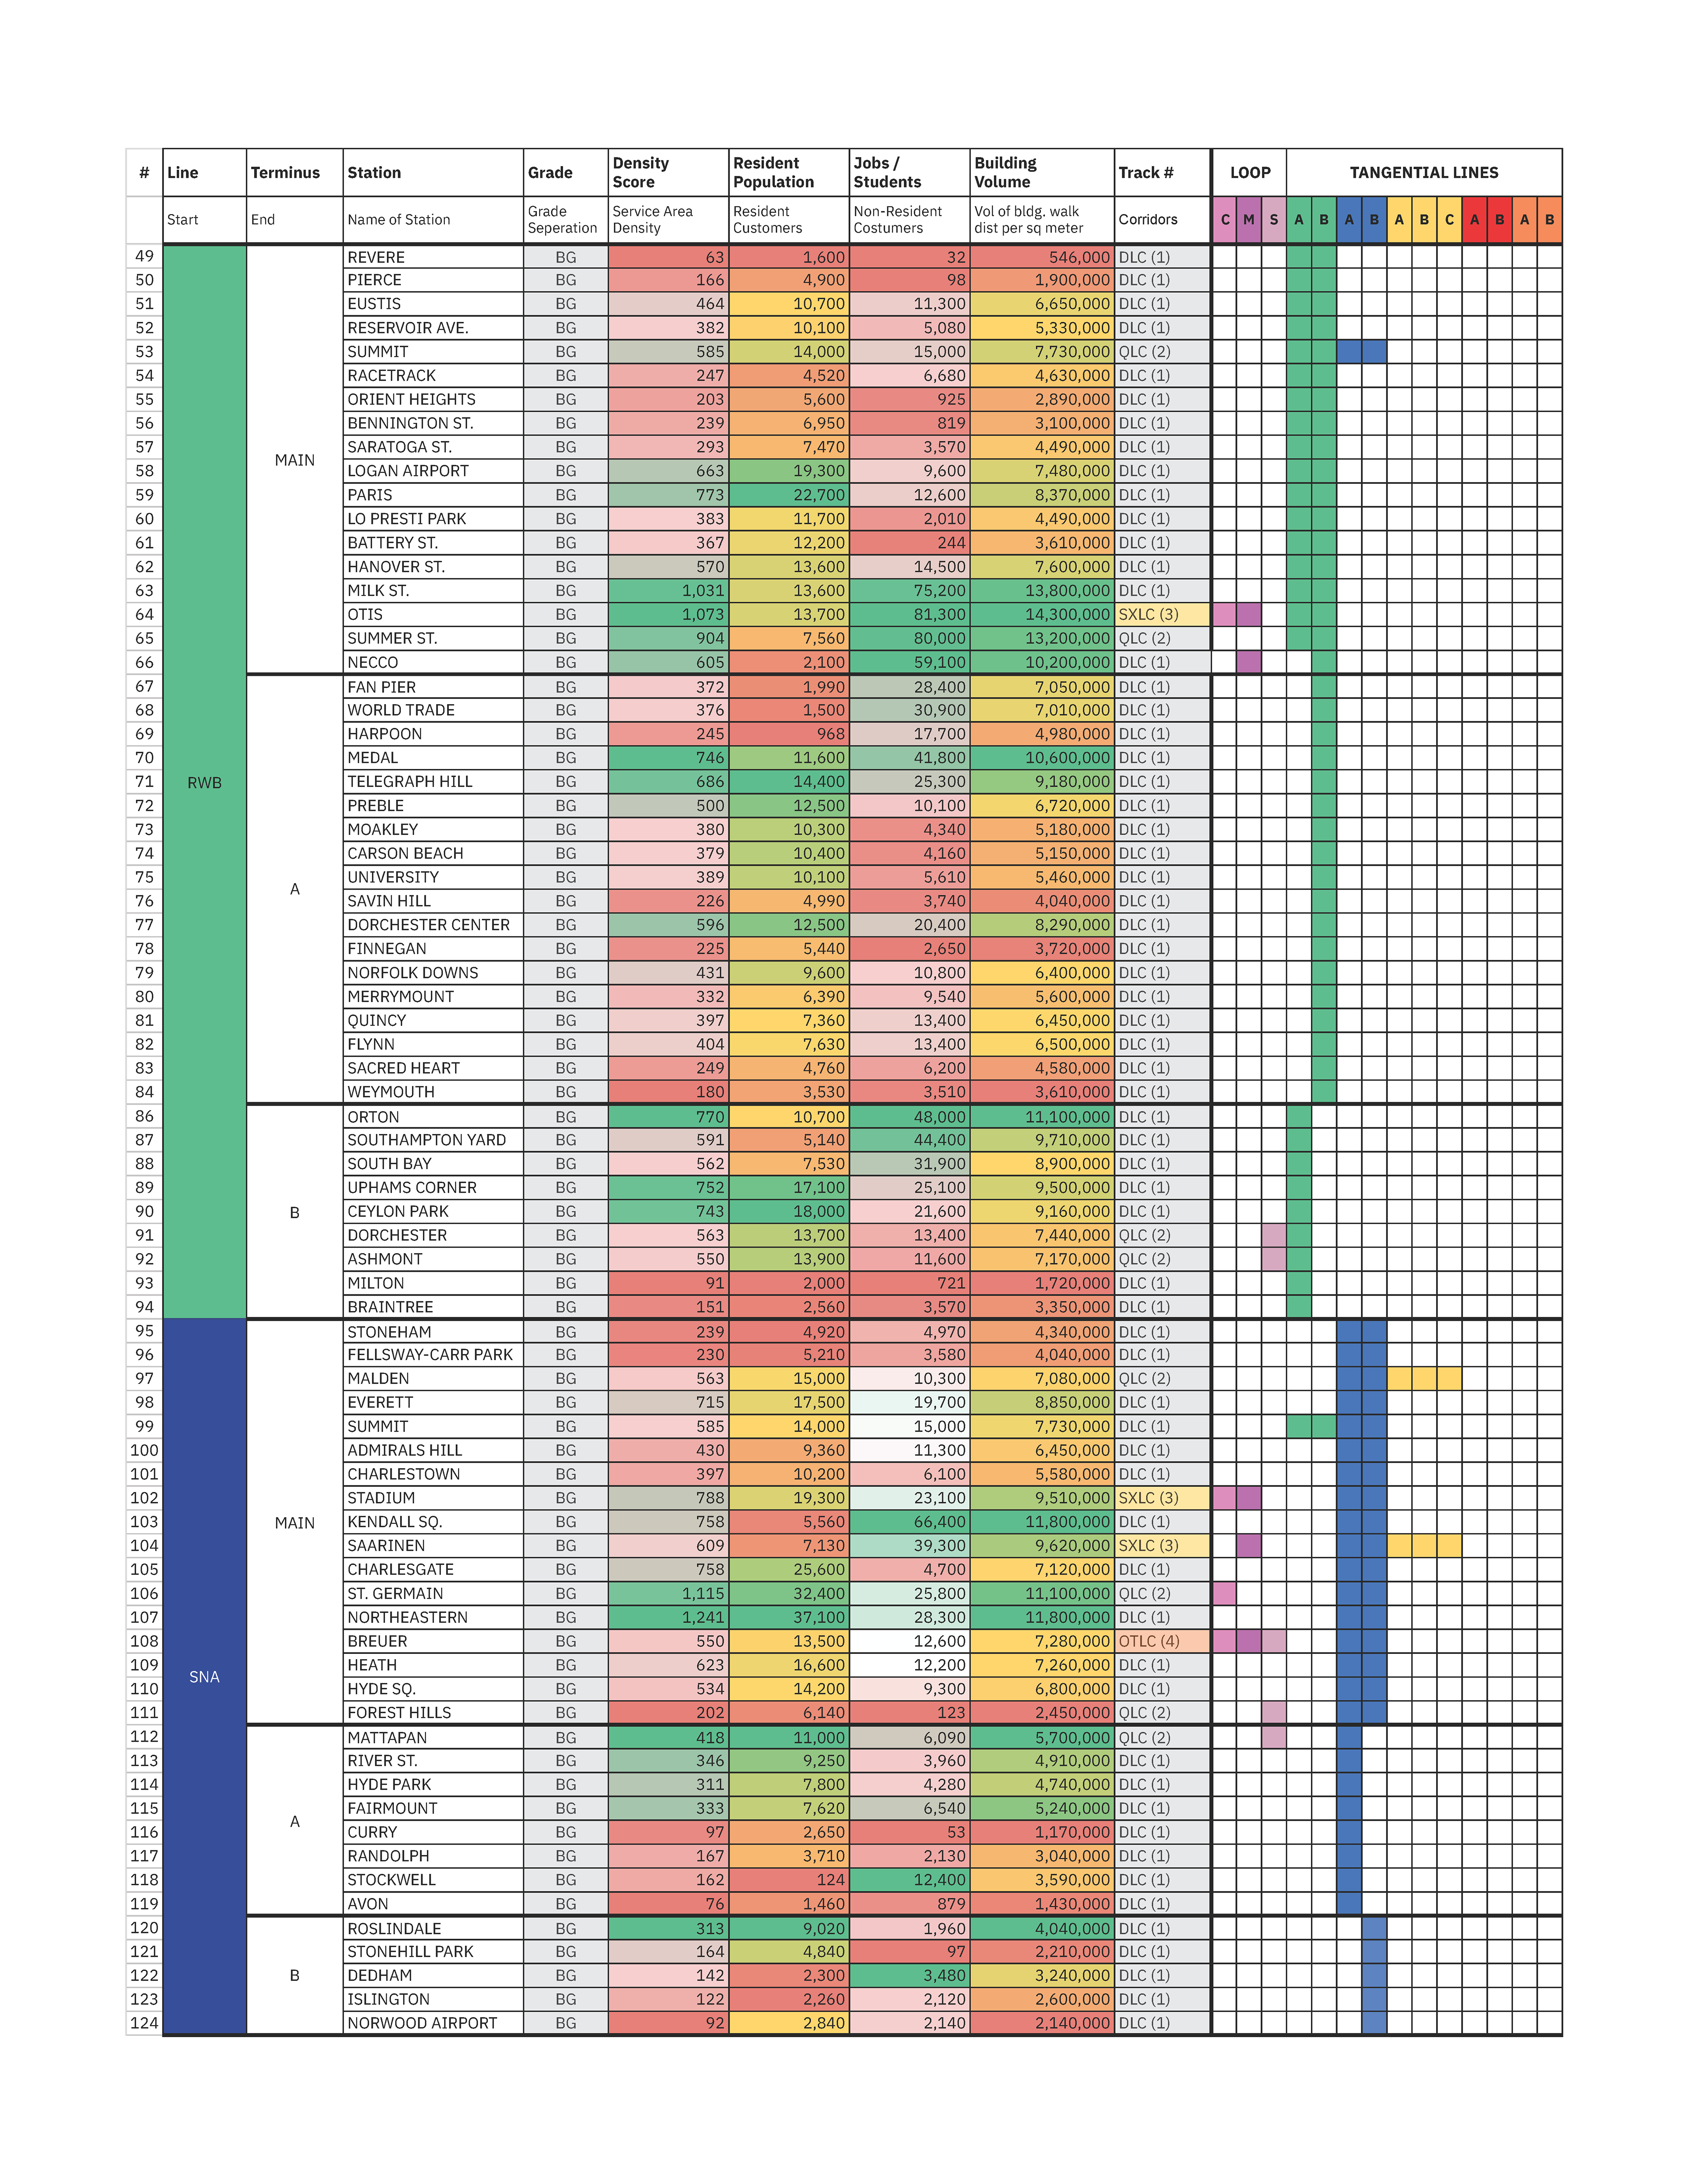
Iteration V Graphic/Table
related coursework
As my time at Wentworth was coming to a close, I decided to enroll in a course on the basics of GIS. Taking this course was extremely helpful to my architectural journey, largely due to my choice of Adaptive Interventions as a concentration pathway and the feeling that I had missed out on some of the concepts taught in the Urbanism pathway. Many of my colleagues from the Urbanism pathway also went on to take this GIS course. As the semester progressed, we learned about the impact GIS has on a multitude of fields by reading Mapping the Nation, an ESRI textbook that aligned with our in-class work using ArcGIS. Our projects mostly involved learning how to operate the ArcGIS desktop application, but I found that I enjoyed the exploration of ArcGIS Online the most. I developed an appreciation for the application and its quirks, diving into complex symbology, reading and implementing CSV files, and utilizing some of the many geoprocessing tools. This experience only made me better equipped to use other geospatial programs, for which I am grateful.
My final project for this course was to tactfully introduce the current progress of my side projects as a thesis. This was published in the form of an ArcGIS web app titled "Rail Corridor Reuse 2050." The goal of this project was not only to showcase some of my custom cartography to my classmates but also to create a narrative using maps from the Norman B. Leventhal Library at the BPL. The narrative walked through the history of rail in the U.S. and Boston, exploring the potential for future development using existing infrastructure.